On this page, you will find instructions for producing anonymous results and examples to support the application of the instructions. At the end of the page, you will find guidance on publishing results from Kapseli or another secure processing environment.
This page contains
Introduction What does anonymisation mean? Descriptive indicators and analyses Graphs Other result types Examples to support the application of the instructions How to expedite the verification of result anonymity Publishing the results Reference guide Report published research results to Findata
Instructions for producing anonymous results
Introduction
If you process personal data, you must produce the results in an anonymous format that does not reveal any information about individuals or their characteristics.
Findata ensures the anonymity of published results. This requirement applies to all results produced from materials that have been authorised under the Act on the Secondary Use of Health and Social Data and processed in a secure processing environment in accordance with said Act. We do not charge a fee for anonymity verification.
Results must be produced so that they comply with these instructions regarding different result types. The aim is to ensure the data protection of published results.
These instructions contain a list of the most common result types and their related disclosure risk. The list is not exhaustive, and the disclosure risk is also affected by the properties of the data and the content of its variables. The anonymity of some result types can be established fairly easily, while other types may require more detailed examination.
When producing results, you have to assess whether the definition of anonymous data is met. Submit your results for verification only once you are confident that they are anonymous.
Verifying the anonymity of results consist of:
- These instructions on producing anonymous results
- The summary form submitted to Findata alongside the results, and
- Checks carried out by Findata.
Fill in the summary form carefully. If you are publishing results from Kapseli, the form is available on the D drive. If you are using another secure processing environment, you can download the form from the link above. The verification of anonymity at Findata relies heavily on the information you provide in the summary form. If needed, we are available to advise you on producing anonymous results.
- Download form: Summary form: Verifying anonymity of results (Word file, 43 kB)
- See also: Publishing results
If you cannot produce results in accordance with these instructions but believe they are anonymous, you must submit justifications on the anonymity as a part of the summary form. Note that results needing case-by-case assessment might take longer to verify. The justifications you submit to Findata must only concern anonymity, not matters such as the importance of getting the research published or the significance of the research.
What does anonymisation mean?
Anonymisation is the process of ensuring that material cannot be used to
- identify any individual directly or indirectly
- draw conclusions about a specific individual
- link data concerning an individual to other materials.
Anonymised material must be impossible or extremely difficult to revert to an identifiable format that could be used to identify a specific individual.
When materials are disclosed under the Secondary Use Act, any subsequent published results must be anonymous (Act on the Secondary Use of Health and Social Data, section 52). If your research requires publishing results that cannot be anonymised, you should take this into account already when planning the research and consider the option of conducting the research under some other legislation than the Secondary Use Act.
Results must be anonymised in a way appropriate to the result type. This can be done, for example, by:
- using sufficiently coarse categories,
- censoring, editing or deleting data involving a disclosure risk, or
- adding uncertainty to the data.
Even if an individual result is anonymous, there is a risk of disclosing an individual person when multiple results are combined. A typical example is producing several frequency tables for representing different data using the same background variable classifications. These tables can be combined to produce a frequency table with more detailed information, which may reveal additional information about the observations in the tables.
When assessing disclosure risk, consider how your results might be combined with current, past, or future analyses. If you are aware of prior publications based on the same or nearly the same material or a subset of it, these must be taken into account.
To ensure anonymity, the starting point is that results are based on data from several observations and that the minimum frequency in the results is three.
Results, such as table cell or group data, must be based on at least three observations.
The use of this threshold criterion is a clear and simple way to reduce the risk of disclosing an individual and ensure the data protection of results. However, you must assess whether the minimum frequency is sufficient for your particular results. Using the threshold value of three does not necessarily guarantee the anonymity of results. For example, if you publish cells showing 0% and 100% (all or none of the individuals have a specific feature), each case must be assessed separately. If you censor a cell with a low cell-specific frequency, make sure that the censored value cannot be calculated using the other values in the table.
In addition to cell-specific frequencies, you must also consider the size of the cell-specific population. This refers to the group of individuals who could fall into the cell based on its defining characteristics (e.g. persons of a certain age living in a particular municipality). A small cell-specific population increases the risk of identifying individuals.
Findata requires sufficient background information for each type of analysis to verify anonymity. This information, such as the number of observations that the results are based on, must be included in the summary form.
Descriptive indicators and analyses
The principles described in the table below form the basis of our anonymity verification process.
| Result type | Disclosure risk | Notes |
|---|---|---|
| Descriptive analyses and indicators | ||
| Frequencies | Usually high | Can be published in principle when the minimum frequency in the results is at least three. See also Example 1. |
| Maximum, minimum, range | Usually high | Can be published in principle when the value of the indicator is based on several observations or if disclosing the individual person can be prevented in some other way. Usually, the minimum and maximum are applied to an individual observation, so these values may pose a risk of disclosure. You can improve the anonymity of your results by dividing your data into categories, as these categories will then include several individuals. Consider using suitable quantiles instead of minimum and maximum figures. See also Example 2. |
| Fractiles (quantiles, deciles, percentiles, median) | Usually high | Can be published in principle when the number of background observations is large enough. |
| Mode | Low | Can be published in principle if all the members of a group are not issued the same value. |
| Mean, standard deviation | Usually high | Can be published in principle, but check that the result represents a sufficiently large group and that the entire target group is not issued the same value. In addition, make sure not to report indicators from several nearly identical groups or subgroups. |
| Indices, ratios, indicators | Low | Can be published in principle, but remember to take your calculation formula into account. Indices produced with more complex formulas (e.g. Fisher Price) do not usually pose a disclosure risk, but very simple formulas are more prone to that risk, in which case your figures must be based on a sufficient number of observations. |
| Degrees of concentration | Low | Can be published in principle when the group under consideration contains a sufficient number of observations. |
| Higher momentum indicators (variance, covariance, kurtosis, skewness) | Low | Can be published in principle because the indicator has been clearly converted from the original individual values. Make sure not to publish an excessive number of indicators from a small group, as they could serve to disclose the entire group. |
| Graphs: visual representations of the original material | Usually high | For more detailed instructions, see the Graphs section. |
| Correlations and regression-type analyses | ||
| Regression coefficients | Low | Can be published in principle. |
| Estimation residuals | Usually high | Residuals refer to a single observation, so there is a disclosure risk. For more detailed instructions, see the Graphs section. |
| Estimate summary and test variables (t, F, R2, χ2 etc.) | Low | Can be published in principle when the group under consideration contains a sufficient number of observations. |
| Correlation factors | Low | Can be published in principle when the group under consideration contains a sufficient number of observations. |
| Factor analysis | Low | Can be published in principle, but make sure that your factors are not based on a single variable. |
| Main component analysis | Low | Main component vectors and their corresponding values can be published in principle. Make sure to check the projections of the main components because they correspond to the scatter plot. For more detailed instructions, see the Graphs section. |
| Correspondence analysis | Low | Can be published in principle. |
The terms “group” and “target group” refer to the observations from which indicators are calculated.
Graphs
The data protection assessment process for graphs relies on aggregated tabular presentations, as they make it easier to perceive the frequency of the observations underlying the points or plots in a graph, which would usually be impossible to discern from the graph itself. If necessary, a table specifying the background of your result should be provided with the graph if said graph is used to depict individual observations or a small target group.
Click the titles below to read more about each result type.
Distribution graphs, histogram
Distribution graphs require special attention to outliers, as they may pose a disclosure risk.
This is particularly challenging at the tails of a normal distribution, where it may not be possible to include the entire tail in the graph. For histograms, ensure the material is classified so that each class contains a sufficient number of observations. This instruction corresponds to the principles that apply to descriptive statistics.
Bar chart
Bar charts must be prepared so that each category includes a sufficient number of observations. This instruction corresponds to the principles that apply to descriptive statistics.
Scatter chart, scatter plot
As a rule, each individual point in a scatter chart is based on a single unit. As such, these charts cannot be published unless the data has been grouped so that each point represents multiple observations.
Scatter charts may only be published if the underlying data would meet anonymisation requirements in tabular form. The assessment must also consider whether the combination of variables used could enable individual identification.
You can improve the anonymity of scatter charts by replacing them with a graph depicting the frequency of observations in grid cells or by adding randomness to your points.
Box plots
Box plots pose a disclosure risk by default, as they contain points referring to individual observations. Outliers are particularly susceptible to causing identification risk. The use of means may also increase the risk of identification. This instruction corresponds to the principles that apply to descriptive statistics.
Residuals
Residuals refer to individual observations. When visualising residuals, prefer a graph format that does not rely on individual points. If a graph based on individual points is used, avoid displaying the axis values.
Survival analysis, Kaplan-Meier curve
The disclosure risk in survival analysis depends on how the analysis is defined. In principle, the results can be published if each step in the curve corresponds to a sufficient number of observations
Individual steps may also be allowed if it is clear that the data underlying the curve cannot be used to infer precise ages or calendar dates. In such cases, however, you must assess how well the background information identifies individuals.
See also Example 3.
Spatial analysis
Spatial analysis is particularly challenging in terms of data protection, as location information usually plays a key role in identifying individuals. Publishing spatial analysis results generally requires reclassifying location information and presenting the data as heat maps instead of individual observation points.
Sankey diagrams
The data protection implications of Sankey diagrams (flow diagrams) depend on the type of information presented. If the diagram depicts exact frequencies, the same principles apply as for descriptive statistics.
See also Example 4.
Other result types
Click the titles below to read more about each result type.
Images and other imaging materials
The privacy risks associated with imaging materials must be assessed on a case-by-case basis. Such materials must not include any identifiers or metadata that could be linked to an individual. The risk of identification can be reduced by limiting the data and lowering the image resolution. If imaging materials can be combined with other data, the risk of identification increases.
For more information on the anonymisation and anonymity of imaging and signal data, see the policy outline prepared by the Expert Group on Data Protection appointed by the Ministry of Social Affairs and Health:
Results based on genome data
The anonymity of results based on genome data must always be assessed on a case-by-case basis.
1. Rare individual genetic variations
Publishing rare significant genetic findings is as a rule permitted if the variation is found in at least three individuals. If fewer than three individuals share the variation, the exact number should be concealed.
When publishing such findings, particular attention must be paid to the risk of identification. A minimum frequency threshold of n=3 may help reduce this risk, but its sufficiency should be evaluated in each case. The smaller the target group and the more background information is provided (such as phenotype or geographical origin) the higher the risk of identifying individuals.
When publishing results related to individual subjects, you must not include:
- exact age,
- a detailed description of the subject’s phenotype,
- medical history,
- the exact geographical area where the subjects were collected, or
- any other information that could compromise the anonymity of the subjects.
Details of the genetic variation may be published if they are already available in public variant databases, including:
- allele frequency,
- clinical significance of the variant,
- rsID identifying the variant, or
- the research method used to identify it.
Table 2 provides an example of how to publish rare genetic findings.
| Causal gene | Disorder | Patient N | Zygosity of variant | Reference transcript | DNA variant | Protein variant | Molecular consequence | Pathogenicity classification | db SNP ID | gnomAD MAF, European | gnomAD MAF, Finnish | SpliceAI | phyloP | CADD |
|---|---|---|---|---|---|---|---|---|---|---|---|---|---|---|
| EPHA2 | Lung cancer | <3 | Heterozygous | NM_004431.5 | c.1171G>C | p.Gly291Arg | missense variant | Likely pathogenic | rs34192549 | 0.01679 | 0.00947 | 0.0100 | 0.135 | 6.37 |
| NRAS | Lung cancer | 5 | Heterozygous | NM_002524.5 | c.183A>C | p.Gln61His | missense variant | Pathogenic/Likely pathogenic | rs121913255 | NA | NA | NA | NA | NA |
| DDR2 | Lung cancer | <3 | Heterozygous | NM_006182.4 | c.716T>G | p.Leu239Arg | missense variant | Likely pathogenic | rs578015216 | 0.000 | 0.000 | 0.000 | 6,32 | 24.5 |
Genetic variations not present in the individual’s own genome
Time-bound genetic mutations that do not occur in the subject’s genome, such as those found in cancer tumours, may be published at an individual level. However, extra caution must be taken to ensure individuals cannot be identified.
When publishing results related to individual subjects, you must not include:
- exact age,
- a detailed description of the subject’s phenotype,
- medical history,
- the exact geographical area where the subjects were collected, or
- any other information that could compromise the anonymity of the subjects.
Where possible, results should be presented in grouped form based on mutation or person classifications.
3. Genealogical research
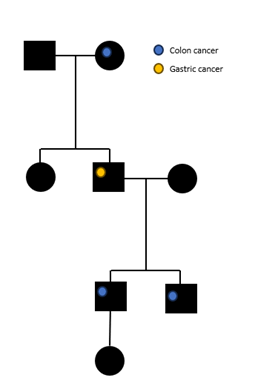
When publishing genealogical results, the anonymity of extended family members must be ensured. Hereditary genetic changes identified through genealogical studies may be presented as pedigrees, as illustrated in Figure 1.
When presenting persons in a pedigree, you cannot include any other detailed background information about them, such as:
- age,
- time of discovery of the genetic changes,
- geographical area from which the genealogical history has been collected, or
- any other information that endangers the anonymity of the family.
The more detailed the information, the greater the risk of identification. In cases of very rare diseases, it is possible that a pedigree cannot be published in anonymous format.
Artificial intelligence (AI) and machine learning models
If an AI or machine learning model/algorithm is the publishable result of your study, you must consider its anonymity already during the development. You must be able to prove the anonymity of the model in order to publish it. Anonymity is assessed on a case-by-case basis.
When submitting a model for anonymity verification, you must also submit the Anonymity form for AI and machine learning models to Findata. You should read the form carefully already when planning the model, so that you are familiar with factors affecting anonymity already when developing the model.
Download the form: Anonymity form for AI and machine learning models (Word, 44 kb)
Anonymity is affected by:
- characteristics of the model itself (e.g. model type, number of parameters to be trained)
- features of the training data (e.g. such as quantity, content, format and possible processing, such as anonymisation)
- the model’s ability to generalise and how it performs the task for which it is trained.
If a model is trained exclusively on anonymous training material, the model itself can also be considered to be anonymous.
The anonymity of a model can be ensured by using differential privacy during training. There are no unequivocal guidelines for selecting the differential privacy parameters, as it depends on the situation and must be justified on a case-by-case basis.
Small values, such as
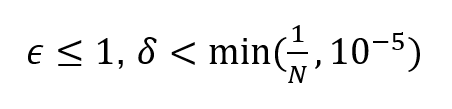
where N is the number of individuals in the material used, produce mathematically strong protection. However, in some cases, even higher values may suffice.
As a rule, training data should not include material containing individual-level direct identifiers. A model with parameters that include information referring to an individual in an understandable format (e.g. text) does not meet anonymity criteria. The development process must also include sufficient measures for assessing the generalisation ability of the model.
Individual-level result materials
As a rule, published results must be based on several observations.
If you need to publish result materials that are individual-level on the whole, the result materials must meet the definition of anonymous data (see What does anonymisation mean?).
Producing individual-level anonymous data usually requires the use of advanced methods, such as differential privacy. The anonymity of individual-level result materials must always be ensured on a case-by-case basis.
Synthetic result materials
The anonymity of synthetic materials depends on:
- the method of generation, and
- the properties of the personal data used as potential background data.
The fact that data is synthetic is not, on its own, sufficient to guarantee anonymity.
Demonstrating anonymity depends largely on the method of generating the data and its complexity. If the aim is to generate anonymous synthetic data, you should consider already when developing the process how the anonymity of the data can be verified. The anonymity of synthetic result materials must always be ensured on a case-by-case basis.
Results of qualitative research
Results produced using qualitative research methods must also be anonymous and meet the definition of anonymous data.
If possible, a minimum frequency of three should be used in published results to ensure data protection. If this is not possible, results must be processed so that individual persons cannot be identified directly or indirectly.
The method of forming the target group affects the risk of identification. Identification risk is higher if the target group includes all the persons meeting certain inclusion criteria compared to a situation where the target group is selected randomly or by sampling.
Especially when publishing quotations from text, you as the producer of the results have to ensure that the quotation does not enable the identification of an individual or event. The risk of identification increases if the quotation contains details of an individual or event or if it concerns a rare phenomenon.
- More information on the anonymisation of qualitative material and related methods is available in Finnish on the Finnish Social Science Data Archive website: Laadullisen aineiston anonymisointi (fsd.tuni.fi).
- See also Example 5.
Examples to support the application of the instructions
Example 1: Frequency table and secondary disclosure
In a frequency table, data in each cell must be based on at least three observations. If the number of observations is less than that, the exact numeric value must be censored. Data referring to fewer than three observations can for example be censored with “<3”.
It should not be possible to calculate the censored value using the other numbers in the table. If the other numbers in the table can be used to determine the exact value of the censored frequency, the other numbers must also be censored.
Example 1.1.
In the table below, the Year 3 cell contains an observation based on fewer than three persons, so it has to be censored.
| Year 1 | Year 2 | Year 3 | Total | |
| Group a, n | 0 | 12 | 1 | 13 |
However, simply censoring the small observation value is not enough, since the other numbers can be used to calculate its exact value. You can prevent that calculation by coarsening the total number or the exact numerical value of another observation value as presented below. When doing so, Year 2 and Total can be used to conclude that the value of the Year 3 cell can be 1 or 2, but the exact value is not known.
| Year 1 | Year 2 | Year 3 | Total | |
| Group a, n | 0 | 12 | <3 | 13–14 |
| Year 1 | Year 2 | Year 3 | Total | |
| Group a, n | 0 | >10 | <3 | 13 |
When the numerical value is zero, you do not usually need to hide it because that data does not refer to any individual person.
Example 1.2.
Two cells of the table below contain an observation based on fewer than three persons (n=1), and both need to be censored.
| Year 1 | Year 2 | Year 3 | Total | |
| Group b, n | 1 | 3 | 1 | 5 |
Even if both of the observation values were censored with <3, the values in Year 2 and Total could be used to deduce that the value of both censored cells is 1. In this case, one way you can prevent the calculation of small observation values is by censoring all three observation values with ≤3.
| Year 1 | Year 2 | Year 3 | Total | |
| Group b, n | ≤3 | ≤3 | ≤3 | 5 |
The situation would be different if, for example, the total amount was 6 (as in table 1.3. in the example below). In this case, it would not have been possible to determine which of the two censored cells marked with <3 had the value 1 and which had the value 2.
Example 1.3.
Observations based on fewer than three persons can also get disclosed by proportional shares. In the example below, even if the small frequencies were censored with <3, it is possible to use the percentages and the total to calculate the exact values of cells Year 1 and Year 2.
| Year 1 | Year 2 | Year 3 | Total | |
| Group c, n | 1 | 3 | 2 | 6 |
| Group c, % | 17.7 | 50 | 33.3 | 100 |
In this case, the percentages have to be censored as well.
| Year 1 | Year 2 | Year 3 | Total | |
| Group c, n | <3 | 3 | <3 | 6 |
| Group c, % | ≤33 | 50.0 | 17–33 | 100 |
Example 2: Minimum and maximum
Minimum and maximum values usually concern an individual observation, so they can involve a disclosure risk, especially in cases where the group size is small and/or individual observations are very abnormal. Minimum and maximum values can be published when the value of the indicator is based on several observations or if the individual’s disclosure risk can be prevented in some other way.
For example, when presenting indicators on the height of subjects, abnormally short or tall persons may stand out from the group, which increases the risk of disclosing the individual. In the group presented in the table below, where the average height is 168 cm, the numerical value of 195 cm stands out as abnormal. People with abnormal characteristics are also more likely to stick in people’s minds, which means that the risk of disclosure is higher.
| Height, cm | |
| Person 1 | 162 |
| Person 2 | 162 |
| Person 3 | 170 |
| Person 4 | 157 |
| Person 5 | 195 |
| Person 6 | 166 |
| Person 7 | 171 |
| Person 8 | 164 |
You can improve the anonymity of your results by dividing your data into categories, as these categories will then include several individuals. Consider using suitable quantiles alongside any minimum and maximum figures.
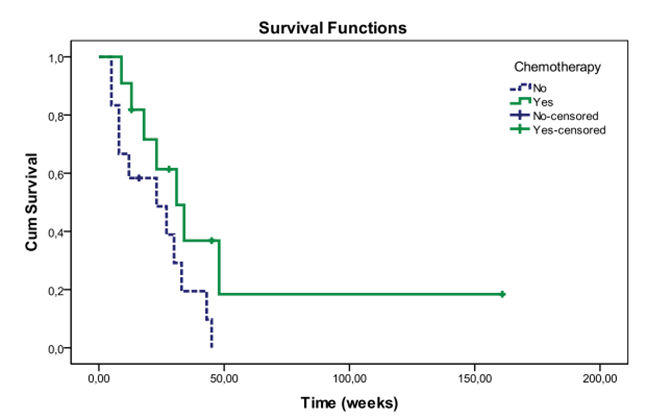
Example 3: Kaplan Meier graph
A Kaplan-Meier graph and its background data can be published if the data behind the graph cannot be used to determine exact calendar dates or individuals’ characteristics, such as age. In this case, even individual steps can be allowed in the graph. The graph in Figure 2 can be published because it cannot be used to identify individuals or to determine precise calendar dates.
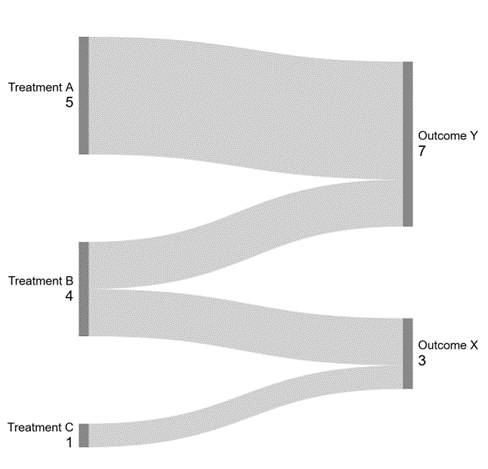
Example 4. Sankey diagram
If a Sankey diagram depicts exact numbers, you have to take the minimum frequency into account in the results. The data in Figure 3 cannot be published without anonymisation, such as reclassification, as the figure determines the exact n< 3 frequencies.
Example 5: Individual-level material and qualitative research
As a rule, published results must be based on several observations. This also applies to qualitative studies. However, if you need to publish individual-level result materials, you have to process the results so that no individual person can be identified from the result materials.
The risk of identification is especially increased in text quotations if the quotation contains details of an individual or event or if it concerns a rare phenomenon. The fictitious quotation below contains the patient’s name and a fair amount of other identifying information.
Eero Example, 13 years old, was brought to Turku University Hospital after he fell in the courtyard of the Turku Yhteiskoulu School. E.E. suffers from haemophilia A. The gastroenterologist who examined E.E. made a referral to…
In text quotations, details can be censored by categorisation, which reduces the risk of identification.
[A patient] [of primary school age] was brought to [a university hospital] for treatment after [they] fell in the courtyard [of their school]. [The patient] has [a severe chronic illness]. [The physician] who examined [the patient] made a referral to…
How to expedite the verification of result anonymity
Producing anonymous results – checklist
| You can use this checklist before submitting published results for anonymity verification. | Done ✓ |
| I have read Findata’s instructions on producing anonymous results. | |
| I have filled in the summary form carefully. | |
| The results meet the definition of anonymous data. | |
| The results do not contain direct identifiers (e.g. name, personal identity code). | |
| The results do not contain strong indirect identifiers (e.g. address, registration number). | |
| The results do not contain pseudo-ID codes (e.g. Findata FID). | |
| The results do not contain cell-specific frequencies n< 3. If the results contain cell-specific frequencies n< 3, I have justified the anonymity of the results. | |
| If small frequencies have been censored, the censored values cannot be inferred from other results. | |
| The results do not contain individual-level data or data that refers to a single person (e.g. minimum, maximum). If the results contain such data, I have justified the anonymity of the results. | |
| I have assessed the anonymity of the results with especial care if the results include: An artificial intelligence / machine learning model Images or other imaging materials Genetic or genomic data Synthetic result materials |
How to expedite the verification of result anonymity:
- Read the instructions on this page carefully. Make sure that the results you produce comply with the instructions.
- If necessary, contact Findata’s help desk (info@findata.fi) if you need help for applying the instructions.
- Fill in the summary form carefully and take all sections of the form into account.
- If the results you have produced do not comply with all the statements, justify why the results can still be considered anonymous. Please note that such results cannot be published without valid justifications.
- Produce results in a format that enables anonymity verification.
- Make sure that all variables are described with names that can be understood by a person not involved in the study.
- Make sure that the result type is clearly presented (e.g. frequency, regression coefficient or some other test statistic).
- Request result extracts from the secure processing environment as a reasonably-sized package.
- We do not recommend submitting individual result packages frequently (e.g. every day). Processing result packages in several different submissions takes more time in terms of data transfer and communication.
- A large number of results will increase the verification time. As a rule, we recommend delivering results in packages of up to 50 files. Processing a very extensive result package with hundreds of files/tabs is a lot of work, especially if any comments have to be made regarding the anonymity of the results.
- Submit the results in a commonly used file format such as Word, pdf, Excel, csv, JPEG, TIFF, or PNG.
- If we cannot open a file you submit, we will have to ask you to deliver the materials again in another file format.
References
- Brandt et al. (2009): Guidelines for the checking of output based on microdata research (PDF file,
755 kb) - European Data Protection Board: Opinion 28/2024 on certain data protection aspects related to the processing of personal data in the context on AI models (edpb.europa.eu)
- Green, E. et al. (2020). Understanding output checking (PDF file, 1 121 kb)
- Griffiths, E. et al. (2019). Handbook on Statistical Disclosure Control for Outputs, version 1.0 2019.
- Hundepool, Anco; Domingo-Ferrer, Josep; Franconi, Luisa; Giessing, Sarah; Schulte-Nordholt, Eric; Spicer, Keith & de Wolf, Peter-Paul (2012). Statistical Disclosure Control.
- Ponomareva et al. (2023). How to DP-fy ML: A Practical Guide to Machine Learning with Differential Privacy. Journal of Artificial Intelligence Research Vol. 77, 2023.
- SankeyMATIC, 2024 (sankeymatic.com)
- Ministry of Social Affairs and Health: Pseudonymisation, anonymisation and the use of direct identifiers in accordance with the Secondary Use Act (522/2019) (in Finnish, PDF file, 418 kb)
Publishing the results
Publication refers to making information publicly available, which includes presenting results outside your immediate working group. This can be in the form of a scientific journal, thesis, textbook, manual, conference presentation, abstract, report, survey, or internet publication.
Publishing results from Kapseli
- Data processing: Data is processed in the Kapseli environment, and only the final analysis results are exported. Results must be in an anonymous format, with Findata ensuring anonymity as per the Secondary Use Act.
- Verify anonymity: Use the guidelines on the page Procucing anonymous results to verify the anonymity of results intended for publication.
- Transfer results: Transfer the results and the summary form to Findata via the Output (O:) drive in Kapseli.
- The summary form for verifying anonymity is located in the Kapseli D-folder under “Käyttöohjeet_User_guide_05062023.”
- Compress the files and the summary form into a zip folder named as follows:
“Results_[Record_number_of_permit_decision][Kapseli_ID][Delivery_date]” (e.g., “Results_THL_1234_14.02.00_2020_a01_15032021”).- Note: Date format should be ddmmyyyy.
- Create an empty text file named “ZZZ_READY.txt” in the Output drive. This triggers the automatic transfer of the zip folder. Ensure the file name is correct.
- Transfers occur hourly and every 30 minutes. Files will be deleted from the Output drive after transfer.
- Notify Findata (optional): Email Findata at data@findata.fi to confirm your transfer. We will follow up if we do not receive your submission. There will be no confirmation of transfer success.
- Review and delivery of results: Findata will review the submission within 5 working days and provide the results via Nextcloud to the permit holder. If additional information is needed, we will contact you.
- For large result files, the review process might exceed the usual 5-day limit. This time limit pertains only to verifying anonymity, not to other file imports from Kapseli (e.g., code files).
- If you don’t have a Nextcloud account, request one via the “Order a new Nextcloud account” form in Findata’s e-service.
Publishing results from other secure operating environments
- Summary form: Download and complete the form for verifying the anonymity of the results
- Download the form: Summary form – verifying the anonymity of the results (Word-file, 40 kB).
- Compress files: Zip the files and the summary form, naming the folder as follows:
- “Results_[Record_number_of_permit_decision][Kapseli_ID][Delivery_date]” (e.g., “Results_THL_1234_14.02.00_2020_a01_15032021”).
- Note: Date format should be ddmmyyyy.
- “Results_[Record_number_of_permit_decision][Kapseli_ID][Delivery_date]” (e.g., “Results_THL_1234_14.02.00_2020_a01_15032021”).
- Transfer results:
- Nextcloud: If you have a Nextcloud account, transfer results via Nextcloud.
- Secure Email: If you do not have a Nextcloud account, transfer results via secure email. Do not send results via regular, non-secure email.
- Contact Findata: Email Findata at data@findata.fi with the subject “Ensuring the anonymity of results.”
- Indicate whether you are using Nextcloud or secure email for the transfer.
- If using Nextcloud, include the diary number of the data permit and your Nextcloud ID. Findata will provide the folder name for your transfer and a zip folder with the summary form.
- If using secure email, Findata will send a secure email for you to reply with your zip folder containing the results and the summary form.
- Follow-up: If there are concerns about the anonymity of the results, Findata will contact you within seven working days.
- If you do not hear from us within this timeframe, you may proceed with publishing your results.
Note: Results exported from Statistics Finland’s Fiona remote processing environment after 18 March 2025 do not need to be submitted separately to Findata for anonymity verification.
Reference guide
If Findata has granted a data permit or made a data request decision for your project, cite Findata in publications as follows: “Sosiaali- ja terveysalan tietolupaviranomainen Findata” or “Finnish Social and Health Data Permit Authority Findata.”
- Follow the writing guidelines of the scientific publication series.
- We recommend that references to Findata be made in accordance with its statutory duties. In data permits, these duties include, for example, pseudonymization and ensuring the anonymity of results, and in data requests, the duties include data integration, aggregation, and anonymization.
- Findata can be referenced in the text, tables, figures, permit lists, acknowledgments, and reference lists.
- Whenever possible, include the diary number(s) of the data permit or data request in the references.
Examples of in-text citations
“Research data was obtained from the Finnish Social and Health Data Permit Authority Findata with data permit THL/XXXX/14.XX.00/20XX. Findata was responsible for the pseudonymization of the data and ensuring the anonymity of the final results.”
“The statistics were produced by Findata, the Finnish Social and Health Data Permit Authority, with data request THL/XXXX/14.XX.00/20XX. Findata was responsible for data integration and producing the anonymized statistics.”
Example of table citation
| Data | Source |
|---|---|
| Research data | Finnish Social and Health Data Permit Authority Findata, data permit THL/XXXX/14.XX.00/20XX |
Example of citation in a reference list
Findata. (Year). Data permit THL/XXXX/14.XX.00/20XX. Finnish Social and Health Data Permit Authority Findata.
Report published research results to Findata
Use the form below to report articles and publications that have made use of data authorised by Findata. One of the criteria for the issuing of a data permit for the purpose of scientific research is that the results are published as scientific publications. The form can also be used to report publications of data authorised for other uses.